KS0414 Keyestudio Turbidity Sensor V1.0: Difference between revisions
Keyestudio (talk | contribs) No edit summary |
Keyestudio (talk | contribs) |
||
| (14 intermediate revisions by the same user not shown) | |||
| Line 1: | Line 1: | ||
[[image: | [[image:0414图片1.png|thumb|400px|right|Keyestudio Turbidity Sensor V1.0]] | ||
<br> | <br> | ||
| Line 13: | Line 13: | ||
Turbidity sensors can be used in measurement of water quality in rivers and streams, wastewater and effluent measurements, sediment transport research and laboratory measurements. <br> | Turbidity sensors can be used in measurement of water quality in rivers and streams, wastewater and effluent measurements, sediment transport research and laboratory measurements. <br> | ||
<span style=color:red>'''Note:''' the top of probe is not water-proof; can only place the transparent bottom part into water. <br> | <span style=color:red>'''Note:''' the top of probe is not water-proof; can only place the transparent bottom part into water. <br> | ||
<br>[[File: | <br>[[File:Ks0414-2.png|600px|frameless|thumb]]<br> | ||
<br>[[File: | <br>[[File:0414图片5.png|600px|frameless|thumb]]<br> | ||
<br> | <br> | ||
| Line 28: | Line 28: | ||
<br> | <br> | ||
== Connection Diagram == | == Connection Diagram == | ||
<br>[[File: | <br>[[File:0414图片3.png|600px|frameless|thumb]]<br> | ||
<br> | <br> | ||
== Electrical Characteristic Curve == | == Electrical Characteristic Curve == | ||
The corresponding table of output voltage and concentration shows that the higher the turbidity value is, the lower the output voltage is. <br> | The corresponding table of output voltage and concentration shows that the higher the turbidity value is, the lower the output voltage is. <br> | ||
| Line 37: | Line 38: | ||
<span style=color:red> 10-6 (PPM)=1ppm=1mg/L=0.13NTU (empirical formula) </span><br> | <span style=color:red> 10-6 (PPM)=1ppm=1mg/L=0.13NTU (empirical formula) </span><br> | ||
that is: <span style=color:red> 3.5%=35000ppm=35000mg/L=4550NTU </span><br> | that is: <span style=color:red> 3.5%=35000ppm=35000mg/L=4550NTU </span><br> | ||
<br>[[File: | <br>[[File:Ks0414-5.png|600px|frameless|thumb]]<br> | ||
<br> | <br> | ||
<span style=color:red>'''Special Notice:''' | <span style=color:red>'''Special Notice:''' | ||
* 1)The top of probe is not water-proof; can only place the transparent part into water. <br> | * 1)The top of probe is not water-proof; can only place the transparent part into water.<br> | ||
* 2)Pay more attention to the power polarity when wiring. Avoid burning out the sensor due to reversed connection. The voltage can only be DC5V; pay close attention to the voltage to prevent overvoltage from burning the sensor. </span> <br> | * 2)Pay more attention to the power polarity when wiring. Avoid burning out the sensor due to reversed connection. The voltage can only be '''DC5V'''; pay close attention to the voltage to prevent overvoltage from burning the sensor. </span> <br> | ||
<br> | <br> | ||
== Source Code == | == Source Code == | ||
<pre> | <pre> | ||
| Line 66: | Line 69: | ||
In the experiment, we slide the switch to A end, then read the analog value shown below. The analog value 0-1023 corresponds to voltage 0-5V. <br> | In the experiment, we slide the switch to A end, then read the analog value shown below. The analog value 0-1023 corresponds to voltage 0-5V. <br> | ||
We can work out the voltage of sensor’s signal end by analog value, and then get the water’s turbidity degree through electrical characteristic curve. | We can work out the voltage of sensor’s signal end by analog value, and then get the water’s turbidity degree through electrical characteristic curve. | ||
<br>[[File: | <br>[[File:0414图片4.png|600px|frameless|thumb]]<br> | ||
| Line 73: | Line 76: | ||
* '''PDF and Code''' <br> | * '''PDF and Code''' <br> | ||
https:// | |||
https://fs.keyestudio.com/KS0414 | |||
<br> | <br> | ||
==Get One Now== | ==Get One Now== | ||
*[https://www.keyestudio.com/keyestudio-turbidity-sensor-v10-with-wires-compatible-with-arduino-for-water-testing-p0546.html Official website ] | |||
*[https://www.aliexpress.com/store/product/Keyestudio-Turbidity-Sensor-V1-0-With-Wires-Compatible-with-Arduino-for-Water-Testing/1452162_32995232611.html?spm=2114.12010615.8148356.1.1e4811dbyQBs9u Buy from aliexpress] | |||
*[https://www.amazon.com/dp/B07Q657288 Buy from amazon] | |||
[[Category: | [[Category: Sensor]] | ||
Latest revision as of 12:27, 7 January 2021
Description
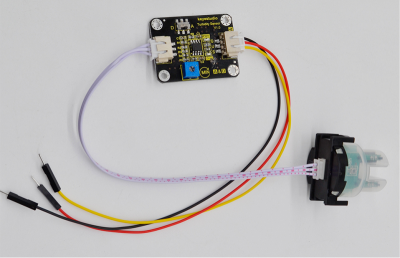
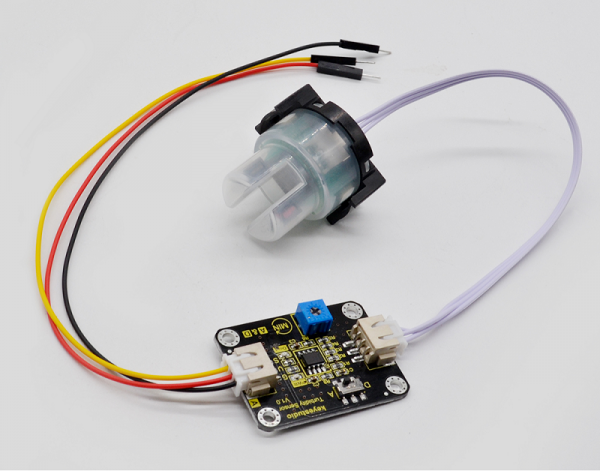
The keyestudio turbidity sensor detects water quality by measuring level of turbidity.
The principle is to convert the current signal itself into the voltage output through the circuit.
Its detection range is 0%-3.5% (0-4550NTU), with an error range of ±05%F*S.
When using, measure the voltage value of sensor’s Signal end; then work out the water’s turbidity by simple calculation formula.
This turbidity sensor have both analog and digital signal output modes.
The module has a slide switch. When slide the switch to A end, connect the signal end to analog port, can read the analog value to calculate the output voltage so as to get the turbidity degree of water. If slide to D end, connect signal end to digital port, can detect the water whether is turbidity by outputting HIGH or LOW level.
You can turn the blue potentiometer on the sensor to adjust the sensitivity of sensor.
Turbidity sensors can be used in measurement of water quality in rivers and streams, wastewater and effluent measurements, sediment transport research and laboratory measurements.
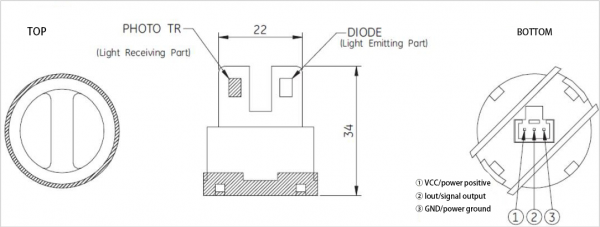
Note: the top of probe is not water-proof; can only place the transparent bottom part into water.
Specification
- Operating Voltage: DC 5V
- Operating Current: about 11mA
- Detection Range: 0%--3.5%(0-4550NTU)
- Operating Temperature: -30℃~80℃
- Storage Temperature:-10℃~80℃
- Error Range: ±0.5%F*S
- Weight: 18g
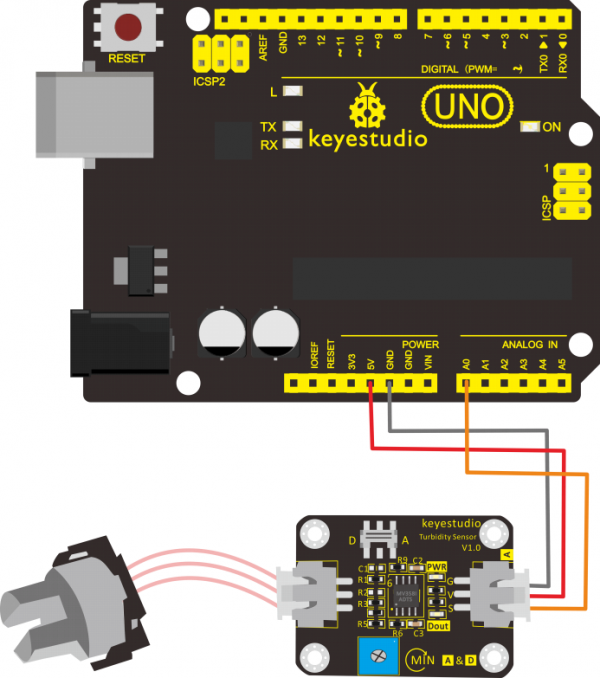
Connection Diagram
Electrical Characteristic Curve
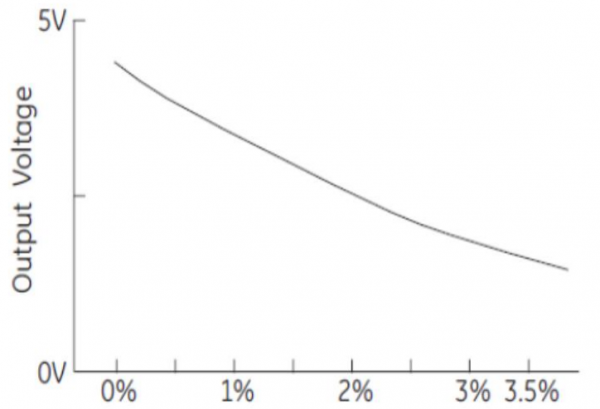
The corresponding table of output voltage and concentration shows that the higher the turbidity value is, the lower the output voltage is.
In the chart, many customers do not know how to convert the percent(%)to turbidity units (NTU).
The following conversion formula is obtained after verification:
10-6 (PPM)=1ppm=1mg/L=0.13NTU (empirical formula)
that is: 3.5%=35000ppm=35000mg/L=4550NTU
Special Notice:
- 1)The top of probe is not water-proof; can only place the transparent part into water.
- 2)Pay more attention to the power polarity when wiring. Avoid burning out the sensor due to reversed connection. The voltage can only be DC5V; pay close attention to the voltage to prevent overvoltage from burning the sensor.
Source Code
void setup() {
  // initialize serial communication at 9600 bits per second:
  Serial.begin(9600);
}

// the loop routine runs over and over again forever:
void loop() {
  // read the input on analog pin 0:
  int sensorValue = analogRead(A0);
  // print out the value you read:
  Serial.println(sensorValue);
  delay(100);        // delay in between reads for stability
}
Test Result
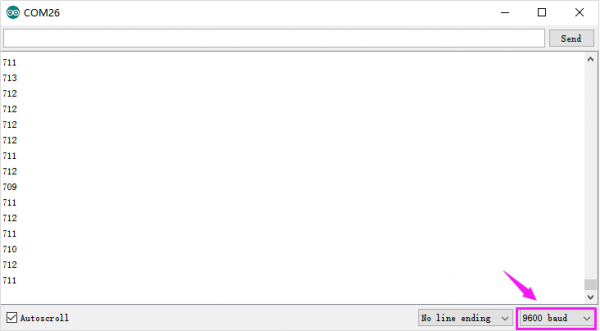
In the experiment, we slide the switch to A end, then read the analog value shown below. The analog value 0-1023 corresponds to voltage 0-5V.
We can work out the voltage of sensor’s signal end by analog value, and then get the water’s turbidity degree through electrical characteristic curve.
Resources
- PDF and Code
https://fs.keyestudio.com/KS0414
